Leaflet Maps
Leaflet is the leading open-source JavaScript library for mobile-friendly interactive maps.
Read the official Leaflet Documentation for a full list of instructions and other options.
Usage#
In order to use leaflet on your page, It is required to include the following vendors css in the "Vendors CSS" area from the page's header:
<link rel="stylesheet" href="../../assets/vendor/libs/leaflet/leaflet.css" />Include the following vendors script in the "Vendors JS" area from the page's footer:
<script src="../../assets/vendor/libs/leaflet/leaflet.js" />Basic#


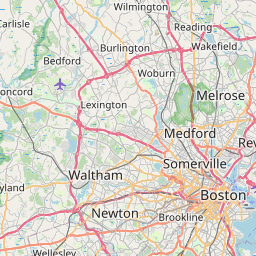
Leaflet Map data © OpenStreetMap
<div class="leaflet-map" id="basicMap"></div>const basicMap = L.map('basicMap').setView([42.35, -71.08], 10);
L.tileLayer('https://{s}.tile.osm.org/{z}/{x}/{y}.png', {
attribution: 'Map data © <a href="https://www.openstreetmap.org/">OpenStreetMap</a>',
maxZoom: 18
}).addTo(basicMap);Marker Shapes#


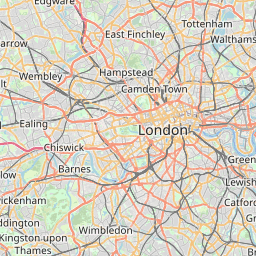
Leaflet Map data © OpenStreetMap
<div class="leaflet-map" id="shapeMap"></div>const markerMap = L.map('shapeMap').setView([51.5, -0.09], 12);
const marker = L.marker([51.5, -0.09]).addTo(markerMap);
const circle = L.circle([51.508, -0.11], {
color: 'red',
fillColor: '#f03',
fillOpacity: 0.5,
radius: 500
}).addTo(markerMap);
const polygon = L.polygon([
[51.509, -0.08],
[51.503, -0.06],
[51.51, -0.047]
]).addTo(markerMap);
L.tileLayer('https://{s}.tile.osm.org/{z}/{x}/{y}.png', {
attribution: 'Map data © <a href="https://www.openstreetmap.org/">OpenStreetMap</a>',
maxZoom: 18
}).addTo(markerMap);Draggable Markers#
Leaflet Map data © OpenStreetMap
<div class="leaflet-map" id="dragMap"></div>const draggableMap = L.map('dragMap').setView([48.817152, 2.455], 12);
const markerLocation = L.marker([48.817152, 2.455], {
draggable: 'true'
}).addTo(draggableMap);
markerLocation.bindPopup("<b>You're here!</b>").openPopup();
L.tileLayer('https://{s}.tile.osm.org/{z}/{x}/{y}.png', {
attribution: 'Map data © <a href="https://www.openstreetmap.org/">OpenStreetMap</a>',
maxZoom: 18
}).addTo(draggableMap);User Location#


Leaflet Map data © OpenStreetMap
<div class="leaflet-map" id="userLocation"></div>const userLocation = L.map('userLocation').setView([42.35, -71.08], 10);
userLocation.locate({
setView: true,
maxZoom: 16
});
function onLocationFound(e) {
const radius = e.accuracy;
L.marker(e.latlng)
.addTo(userLocation)
.bindPopup('You are somewhere around ' + radius + ' meters from this point')
.openPopup();
L.circle(e.latlng, radius).addTo(userLocation);
}
userLocation.on('locationfound', onLocationFound);
L.tileLayer('https://{s}.tile.osm.org/{z}/{x}/{y}.png', {
attribution: 'Map data © <a href="https://www.openstreetmap.org/">OpenStreetMap</a>',
maxZoom: 18
}).addTo(userLocation);Custom Icons#


Leaflet Map data © OpenStreetMap
<div class="leaflet-map" id="customIcons"></div>const customIcons = L.map('customIcons').setView([51.5, -0.09], 10);
const greenLeaf = L.icon({
iconUrl: assetsPath + 'img/icons/misc/leaf-green.png',
shadowUrl: assetsPath + 'img/icons/misc/leaf-shadow.png',
iconSize: [38, 95],
shadowSize: [50, 64],
iconAnchor: [22, 94],
shadowAnchor: [4, 62],
popupAnchor: [-3, -76]
});
const redLeaf = L.icon({
iconUrl: assetsPath + 'img/icons/misc/leaf-red.png',
shadowUrl: assetsPath + 'img/icons/misc/leaf-shadow.png',
iconSize: [38, 95],
shadowSize: [50, 64],
iconAnchor: [22, 94],
shadowAnchor: [4, 62],
popupAnchor: [-3, -76]
});
const orangeLeaf = L.icon({
iconUrl: assetsPath + 'img/icons/misc/leaf-orange.png',
shadowUrl: assetsPath + 'img/icons/misc/leaf-shadow.png',
iconSize: [38, 95],
shadowSize: [50, 64],
iconAnchor: [22, 94],
shadowAnchor: [4, 62],
popupAnchor: [-3, -76]
});
L.marker([51.5, -0.09], {
icon: redLeaf
}).addTo(customIcons);
L.marker([51.4, -0.51], {
icon: greenLeaf
}).addTo(customIcons);
L.marker([51.49, -0.45], {
icon: orangeLeaf
}).addTo(customIcons);
L.tileLayer('https://{s}.tile.osm.org/{z}/{x}/{y}.png', {
attribution: 'Map data © <a href="https://www.openstreetmap.org/">OpenStreetMap</a>',
maxZoom: 18
}).addTo(customIcons);GeoJson#


Leaflet Map data © OpenStreetMap
<div class="leaflet-map" id="geoJson"></div>const geoJsonMap = L.map('geoJson').setView([44.2669, -72.576], 3);
L.geoJson(statesData).addTo(geoJsonMap);
function getColor(d) {
return d > 1000
? '#800026'
: d > 500
? '#BD0026'
: d > 200
? '#E31A1C'
: d > 100
? '#FC4E2A'
: d > 50
? '#FD8D3C'
: d > 20
? '#FEB24C'
: d > 10
? '#FED976'
: '#FFEDA0';
}
function style(feature) {
return {
fillColor: getColor(feature.properties.density),
weight: 2,
opacity: 1,
color: 'white',
dashArray: '3',
fillOpacity: 0.7
};
}
L.geoJson(statesData, {
style: style
}).addTo(geoJsonMap);
L.tileLayer('https://{s}.tile.osm.org/{z}/{x}/{y}.png', {
attribution: 'Map data © <a href="https://www.openstreetmap.org/">OpenStreetMap</a>',
maxZoom: 18
}).addTo(geoJsonMap);Layer Control#


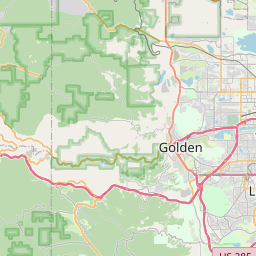
<div class="leaflet-map" id="layerControl"></div>const littleton = L.marker([39.61, -105.02]).bindPopup('This is Littleton, CO.'),
denver = L.marker([39.74, -104.99]).bindPopup('This is Denver, CO.'),
aurora = L.marker([39.73, -104.8]).bindPopup('This is Aurora, CO.'),
golden = L.marker([39.77, -105.23]).bindPopup('This is Golden, CO.');
const cities = L.layerGroup([littleton, denver, aurora, golden]);
const street = L.tileLayer('https://{s}.tile.osm.org/{z}/{x}/{y}.png', {
attribution: 'Map data © <a href="https://www.openstreetmap.org/">OpenStreetMap</a>',
maxZoom: 18
}),
watercolor = L.tileLayer('http://tile.stamen.com/watercolor/{z}/{x}/{y}.jpg', {
attribution: 'Map data © <a href="https://www.openstreetmap.org/">OpenStreetMap</a>',
maxZoom: 18
});
const layerControl = L.map('layerControl', {
center: [39.73, -104.99],
zoom: 10,
layers: [street, cities]
});
const baseMaps = {
Street: street,
Watercolor: watercolor
};
const overlayMaps = {
Cities: cities
};
L.control.layers(baseMaps, overlayMaps).addTo(layerControl);
L.tileLayer('https://c.tile.osm.org/{z}/{x}/{y}.png', {
attribution: 'Map data © <a href="https://www.openstreetmap.org/">OpenStreetMap</a>',
maxZoom: 18
}).addTo(layerControl);


